soundsieve [v1.0]
Here’s a screenshot from the thing I’ve been working on for most of the past week:
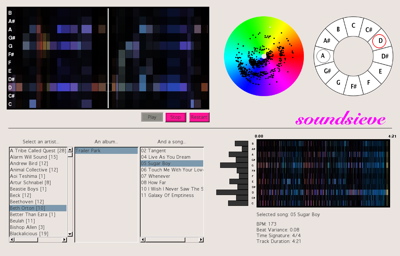
I was getting it ready to show sponsors this week at the Media Lab. People responded really well, and it was lots of fun talking to people and hearing what they had to say. I already have a long list of things I want to do with it over the summer (starting with making it an iTunes plugin).
Here’s some text from the handout:
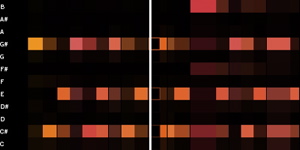
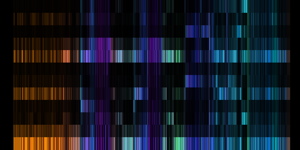
soundsieve is a music visualizer that takes the intrinsic qualities of a musical piece – pitch, time, and timbre – and makes their patterns readily apparent in a visual manner. For example, you can quickly pick out repeating themes, chords, and complexity from the pictures and video.
It’s a new, informative way to look at your music. It allows you to explore the audio structure of any song, and will be a new way to interact with your whole music library, enabling you to navigate the entire space of musical sound.
The current form of soundsieve is a music browser (like iTunes), that lets you see visual representations of any MP3 you own. You select a song, and see a set of pictures of the piece’s audio structure. Then you can choose to play the song, and see real-time visualizations accompanying the piece.
I posted some early documentation on the project, but I’ll have to go through and update it soon.
Spectrograms to hide images in music
Spectrograms are pictures of sound over time. People use them to visualize waveforms, often to try to highlight musical relationships or sounds in speech.
Here’s what someone saying “She sells sea shells” looks like (spectrogram on bottom):

You can go the other way, too, by drawing a picture in a spectrogram and playing the sound it represents. Several musicians have used this to hide pictures in their albums. In many cases, you’ll hear some weird noise at the end of a track… and when the waveform is put through a spectrum analyzer, you get the picture back.
There are some fairly ridiculous examples of this…
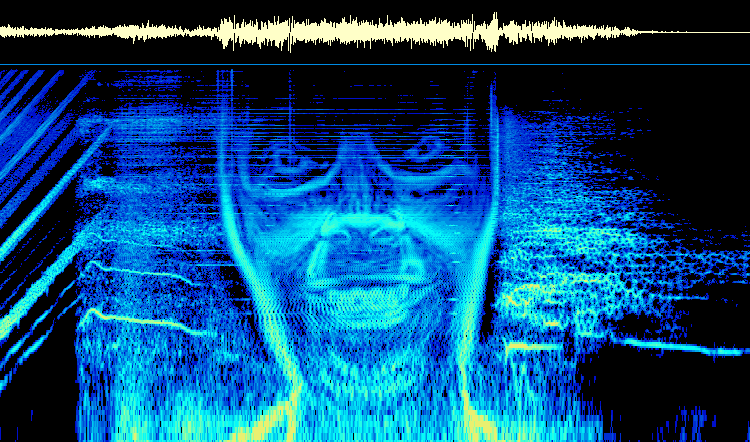 Aphex Twin: Windowlicker |
 NIN: viral marketing |
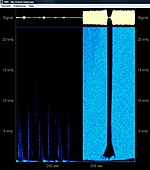 NIN: My Violent Heart |
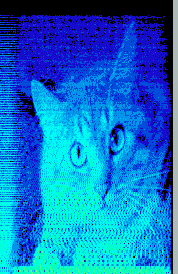 Venetian Snares: Songs About My Cats |
A good description of finding these hidden pictures can be found here: http://www.bastwood.com/aphex.php
…and, of course, there is a Wikipedia section devoted to it.
Nerd fact. And an old way to display data.
- MIT has an a capella group called the Chorallaries. That is just about the nerdiest thing I’ve ever heard. Except for the Integration Bee.
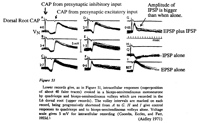
- In HST.723 today, our teacher was telling us about an experiment “they did back in the 50s”, when people didn’t have easy ways of getting the data off of oscilloscopes. (They were measuring action potentials in neurons.) So, instead of tabulating data and creating graphs showing just the average, variance, etc. (like they would today), they just showed the 20 scope traces, all on top of each other, on the same axes. This struck me as a really straightforward, elegant (even though it may now be generally considered crude), way to show all of the data, while letting the user summarize it themselves.
Visualizing Music
This is the place to post comments to Visualizing Music, a project I have been working on for the past month or two.
The first thing
Choosing something to start with is an intimidating task. I think I’m going to make an allowance that I do not have to choose just one thing each day; rather, I can choose as many as I want. Hooray for more things worth learning!
That said, here is the thing I choose as “the best thing i learned today”:
I’m reading Brian C. J. Moore’s An Introduction to the Psychology of Hearing. In the section entitled “Basic Structure and Function of the Auditory System” (specifically, pp. 22-23 in the 5th edition), Moore discusses the functions of the middle ear (aka those little bones you learned about in elementary school – the hammer, the anvil, and the stirrup). The first function is to transmit sound effectively from the air in the ear canal to the fluid in the cochlea just past your eardrum (it’s an impedance-matcher), which is a really beautiful thing, if you look closely at it.
But the second function, he says, is to “reduce the transmission of bone-conducted sound to the cochlea.” If you’re chewing, the bones in your skull would naturally vibrate, including the bones in your middle ear. These little ear bones would transmit the waves to the cochlea, so these noises would “appear loud and have the effect of masking external sounds.” Bad news. However, the guy who studied all of this, Bárány, showed that the sounds are only transmitted to the cochlea “when there is differential movement between the ossicles and the skull.” Our middle ear is positioned exactly so that it minimizes this possible differential movement. So we can still hear when we’re eating! And, perhaps even more interesting, Moore suggests that birds and reptiles, who have a more simple middle ear that does transmit skull vibrations to the cochlea, “swallow their food whole rather than chewing it, whereas mammals chew their food.”
Wow. I mean, seriously. Is it for real? Only the speculation of science knows!
Close competitors:
- Arrive on time for talks by Edward Tufte, if you really want to see him.
- T stops now appear on Google maps
- A search for “blood blisters” is the second-most common referrer to my website, behind “anita lillie”, so far this month.