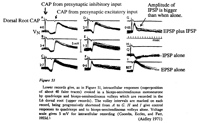
Nerd fact. And an old way to display data.
- MIT has an a capella group called the Chorallaries. That is just about the nerdiest thing I’ve ever heard. Except for the Integration Bee.
- In HST.723 today, our teacher was telling us about an experiment “they did back in the 50s”, when people didn’t have easy ways of getting the data off of oscilloscopes. (They were measuring action potentials in neurons.) So, instead of tabulating data and creating graphs showing just the average, variance, etc. (like they would today), they just showed the 20 scope traces, all on top of each other, on the same axes. This struck me as a really straightforward, elegant (even though it may now be generally considered crude), way to show all of the data, while letting the user summarize it themselves.

No Comments
Be the first to comment!