LastGraph
Make graphs of your last.fm listening history at LastGraph.
This is from my profile data:
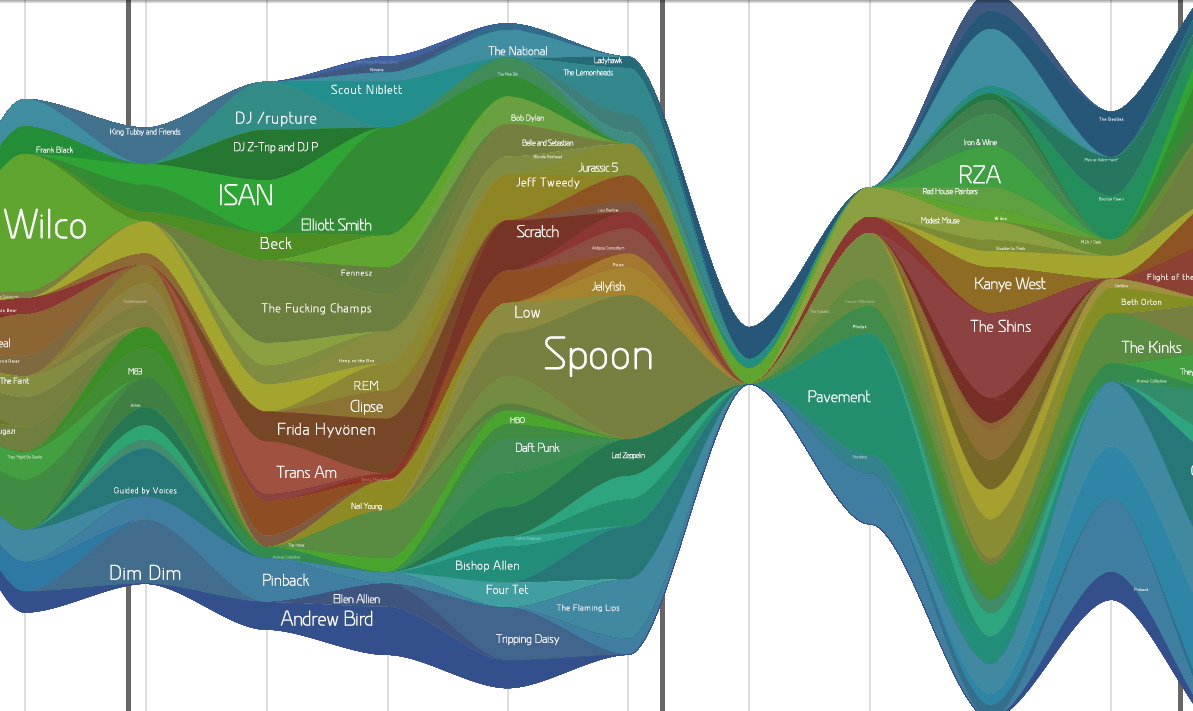
Get the detailed PDF from which the above was captured (it’s so pretty).
The Mathematics in Music
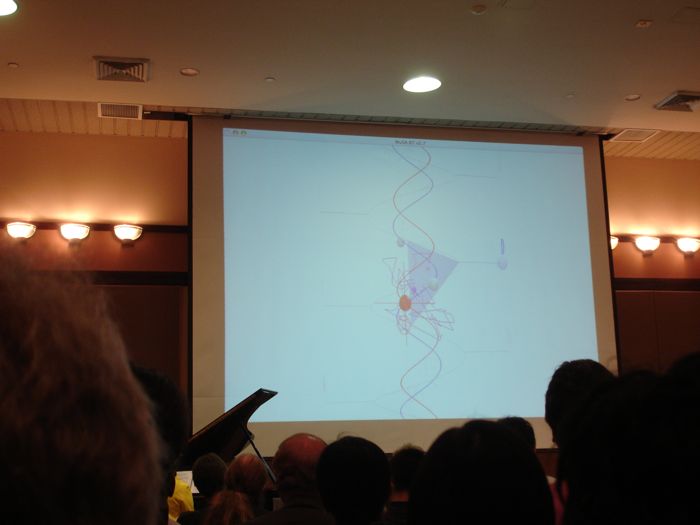
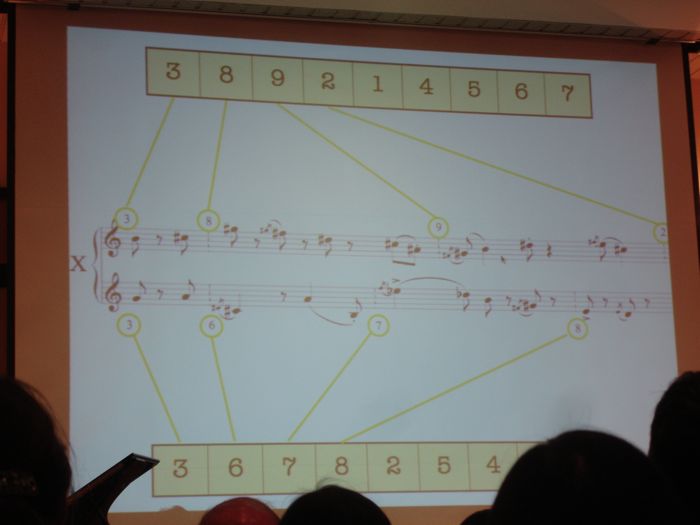
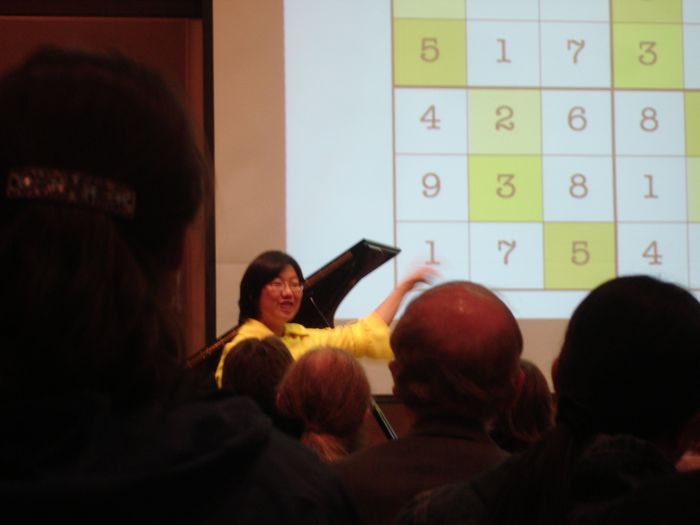
I went to a very interesting performance today: “The Mathematics in Music: a concert-conversation with Elaine Chew”, in Killian Hall at MIT. Elaine is visiting Harvard for the year from USC, where she is a professor. She has an amazingly broad background that is super-pleasing… having studied math, computer science, music performance, and operations research.
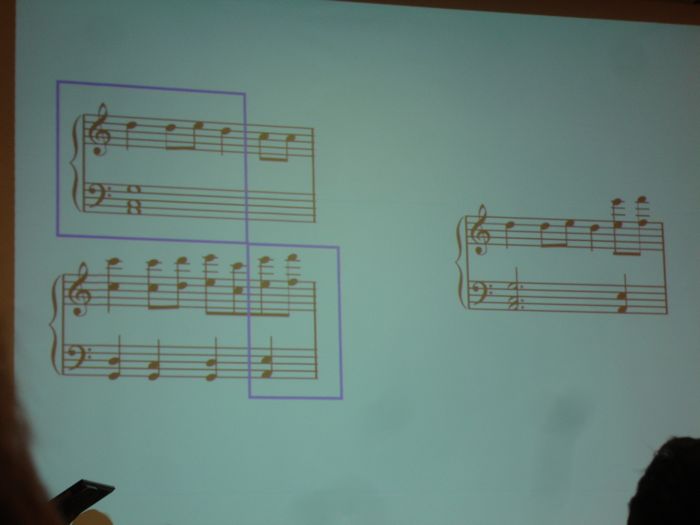
Elaine performed four piano pieces, three of which were composed just for her, that use playful tricks in math as compositional inspiration. Some of these tricks included:
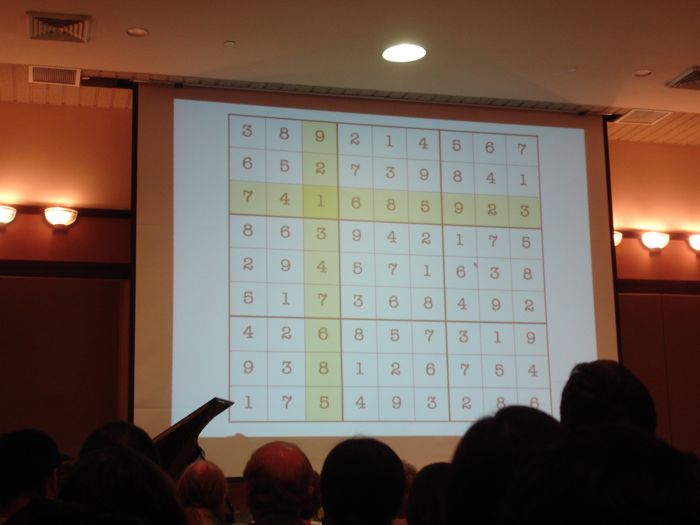
- Composing with a meter determined by the numbers in a row (or column) of a completed Sudoku puzzle. This piece had a different time signature for every measure… 3/8, 1/8, 7/8, 9/8, and so on, accompanied by an entirely different sequence for the other hand. I was very impressed that anyone could play a piece like that. Listening in the audience, you want desperately to tap your foot to ground yourself in some kind of beat, but it’s impossible.
- A bi-tonal piece: right hand and left play in different keys. Chew likened this to patting your head and rubbing your belly at the same time.
- Genetic programming: The composer applies the idea of genetic mutations and substitutions on a familiar theme at the note and phrase level, which results in some jarring effects.
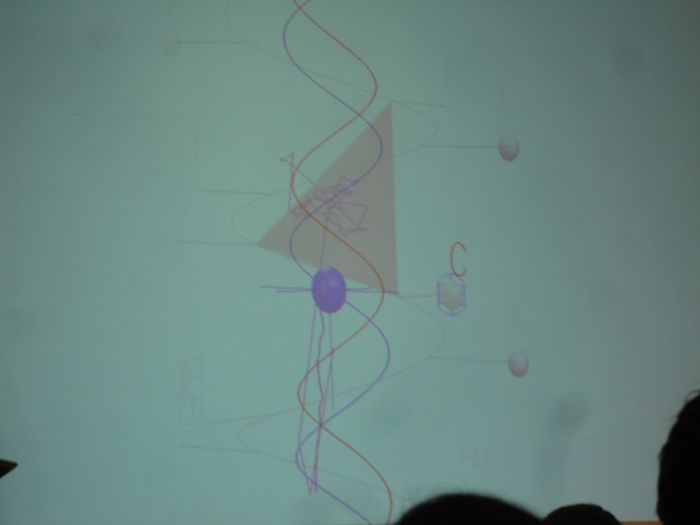
Elaine and her colleague, Alexandre Francois, developed a way of visualizing tonality called MuSA.RT, which accompanied her during two of the pieces. MuSA.RT shows (as a real-time accompaniment to MIDI-enabled piano) the changing notes and key of the piece along a spiral that is kind of like a 3-D version of the Tonnetz. More on the model in Elaine’s paper (PDF).
Haeckel illustrations


Ack! I almost wet myself just now, after realizing that tons of Ernst Haeckel illustrations are available in high-res, in the public domain, on Wikipedia. I am downloading them now. I’m going to cycle through them for my desktop background. And someday I am going to make them into wallpaper prints. (You know, when I get some walls.) Seriously, can you imagine??
This one would look awesome in the guest bathroom…

If you’d like a zip file of all the Haeckel images I downloaded, you can get it here. It’s 187 MB, 121 images.
Tea patterns
I love watching patterns form in a hot cup of coffee or tea. You see deep swirls when liquids mix, and funny arrangements coming alive on the surface.
Yesterday morning, my tea was doing something really weird. There were tiny micro-bubbles on the surface, forming and popping rapidly in the shape of tree branches. What’s going on here? Are there branchy fractals on the surface of my Throat Coat?
These videos are in real-time.
Teacup 1 (QuickTime, 3.2 MB)
Teacup 2 (QuickTime, 1.6 MB)
TED Talks
(My last post was almost two months ago! I never intended to neglect “best thing” for so long, but all I can say is that I have been very busy. And now I have learned that the momentum of pausing a thing like this can be ridiculously self-maintaining… as I suppose momentum tends to be. Argh.)
Tonight I realized that my best professor friend ever, Deborah Gordon, gave a TED Talk back in 2003 about her work on ants. The video has just been posted on the TED Talks site. It’s a great introduction to a very interesting subject, and I count myself as lucky to have participated in the exact bits of tedious work she describes in that talk. If you haven’t seen her speak before, you’ll get to see some of her characteristic say-it-exactly-how-it-is-but-somehow-it’s-funny comments.
In other news, my current advisor, Tod Machover, will be speaking at this year’s TED conference. So I’ll be looking out for that one.
…And one more, from last year, by our soon-to-be-departed (a.k.a. soon-to-be-much-missed), TED-regular John Maeda.
Martin Wattenberg’s advice to me
Tonight I went to see Martin Wattenberg (from IBM’s Visual Communication Lab) talk about visualizing the patterns in Wikipedia edit histories (see history flow and chromogram). It was very fun, very interesting, and makes me think it’s possible to have a job that feels like play.
Afterwards I asked Martin if he had any advice for me, as I’m about to embark on my Masters thesis work, which is really just a big visualization project devoted to looking at people’s music collections. I was wondering what kinds of coding tools he’d recommend. (All of his Wikipedia visualizations were built in Java.) He said, “You’ve got one big question to answer first… Do you want to put this on the web, or not?” If I want it on the web, he says, go Flash; if not, try Processing. And he strongly suggested making it for the web, because that creates the possibility for an instant community and lets the project take on a life of its own.
Thursday, November 15, 7-9 pm
Visualizing Wikipedia: A tale of life, love, and bureaucracy
Martin Wattenberg and Fernanda Viegas (in spirit) , IBM Visual Communication Lab
Abstract: We report on Wikipedia’s evolution from a curiosity to a point of first
reference for millions. Applying data visualization techniques to
Wikipedia’s historical archives uncovers a story in three acts: life, love,
and bureaucracy. “Life” refers to the impressive ability of Wikipedia to
heal itself after vandalism and errors. “Love” is reflected in the
overwhelming scale of individual production and the passion shown by devoted
editors. And bureaucracy–an unexpected aspect of a free-spirited
community–is becoming prevalent as the site scales, with emerging
formalized processes and roles that help ensure quality.
Martian colors
 I went to see Oliver Sacks talk about his new book Musicophilia at the Cambridge Forum on Monday night, in Harvard Square. He described one very interesting phenomenon that I’ve never heard of before… that colorblind people with synesthesia can sometimes have associations that result in the perception of colors they have never seen in the real world. These colors are called “martian colors”.
(Much more info in this great blog post.)
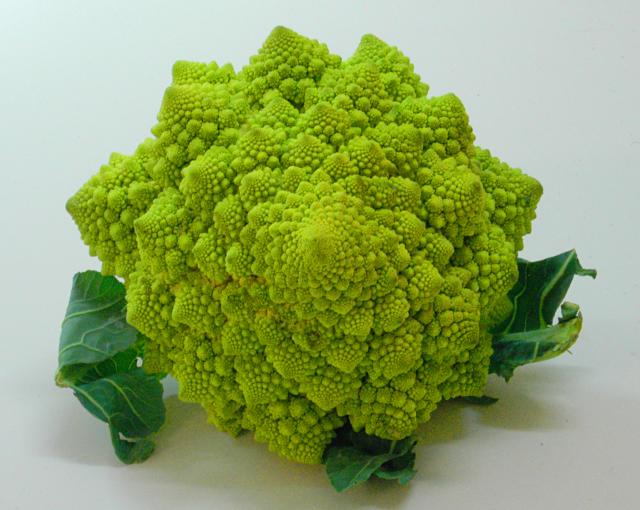
Romanesco
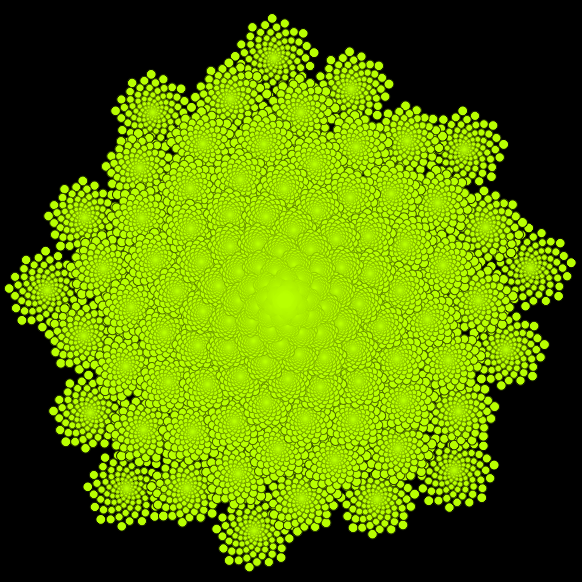
In honor of getting to see Benoît Mandelbrot speak yesterday at IBM in Cambridge, and of his mention of the crazy-cool cauliflower/broccoli mix romanesco, I tried to draw a 2-D version of the fractal veggie in Processing. I wanted to project it onto cones, but I just don’t have the time right now.
This is a fractal-like thing I made up from Fermat’s spiral and discs, which I’ve been playing around with lately.
Another really nice photo of romanesco
Nice collection of photos and commentary on romanesco and fractals
Fermat’s spiral + Processing => applet!
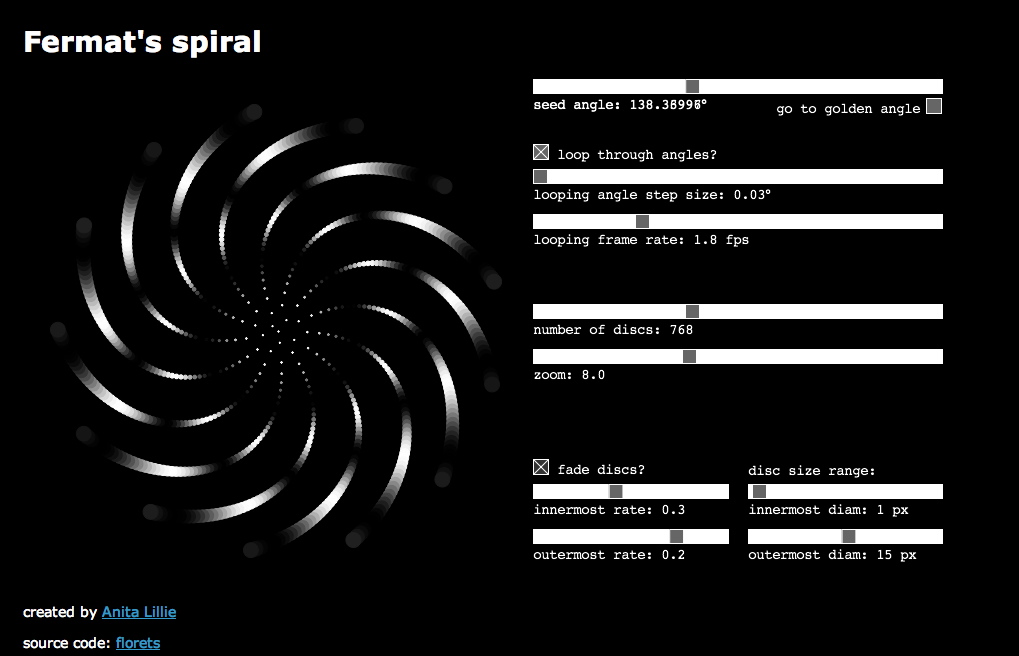
The obsession with the spirals continues… but! It is almost over, for now anyway. I didn’t want to put it aside until I had made something I could share with people.
And here is that something. Come play with ze nue applet! Make pretty pictures and hypnotize yourself!
omphaloskepsis
From Wikipedia:
“Omphaloskepsis is the contemplation of one’s navel as an aid to meditation.”
Apparently people who practice omphaloskepsis have taken Fermat’s spiral as their symbol.

