Spectrograms to hide images in music
Spectrograms are pictures of sound over time. People use them to visualize waveforms, often to try to highlight musical relationships or sounds in speech.
Here’s what someone saying “She sells sea shells” looks like (spectrogram on bottom):

You can go the other way, too, by drawing a picture in a spectrogram and playing the sound it represents. Several musicians have used this to hide pictures in their albums. In many cases, you’ll hear some weird noise at the end of a track… and when the waveform is put through a spectrum analyzer, you get the picture back.
There are some fairly ridiculous examples of this…
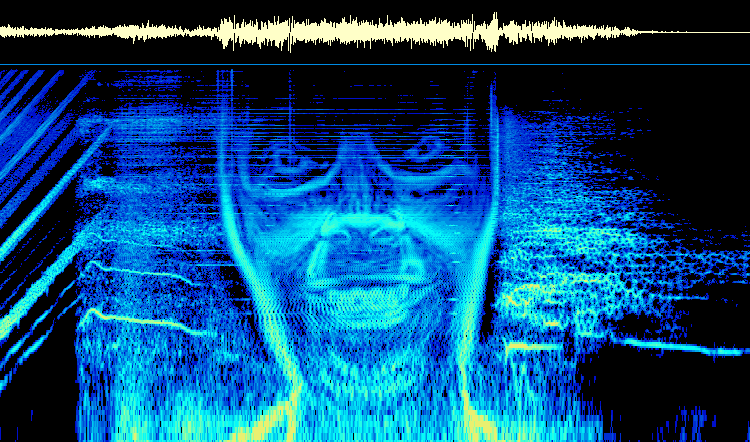 Aphex Twin: Windowlicker |
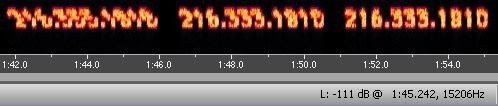 NIN: viral marketing |
 NIN: My Violent Heart |
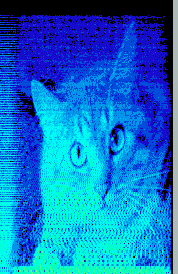 Venetian Snares: Songs About My Cats |
A good description of finding these hidden pictures can be found here: http://www.bastwood.com/aphex.php
…and, of course, there is a Wikipedia section devoted to it.
One Comment
- Roger replied:
Last year’s MIT Mystery Hunt had a puzzle about this. White Noise.
May 1st, 2007 at 12:59 pm. Permalink.
