Fermat’s spiral + Processing => applet!
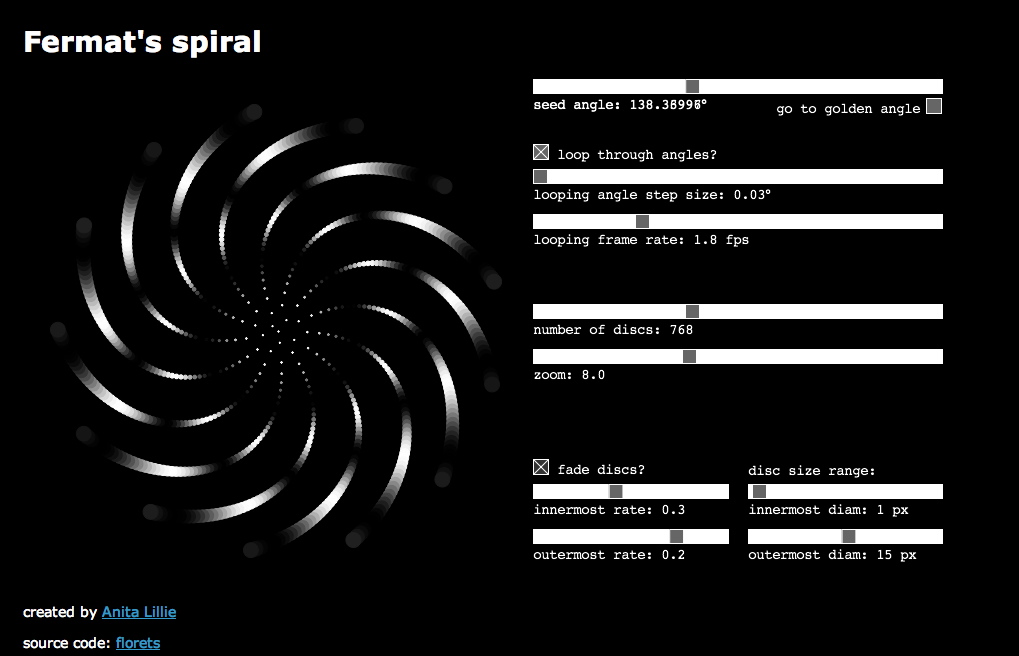
The obsession with the spirals continues… but! It is almost over, for now anyway. I didn’t want to put it aside until I had made something I could share with people.
And here is that something. Come play with ze nue applet! Make pretty pictures and hypnotize yourself!
4 Comments
- Brent replied:
wow, sweet. this rocks.
July 19th, 2007 at 6:14 pm. Permalink.
- black replied:
nice!
July 20th, 2007 at 9:14 pm. Permalink.
- Scott replied:
Very cool. I had a few thoughts as I was watching it spiral. You can see the fractions with small denominators coming from a long ways away. But given how evenly spaced everything looks when you use the golden angle, I was wondering if there was some sense in which that angle is “further away” from such rationals than other irrationals.
So I tried coming up with a simple function that would weight the values in the range [0, 1] based on how close they are to various rational numbers. The simplest way is to weight things proportional to the denominator (so 1/5782 gets less weight than 1/3 since it’s harder to notice) and linearly against the fractions (e.g. simply drawing straight lines from a/b to the midpoint between a/b and (a+1)/b).
To illustrate, start with the fractions 0/1 and 1/1. Draw a line from (0,1) to (1/2, 0) to (1,1). This gives you large values near 0 and 1 and smaller values the further you get from them. Do something similar with the fractions 0/2, 1/2 and 2/2, so you have larger values closer to the fractions and smaller values further from the fractions. Draw lines from (0,1) to (1/4,0) to (1/2,1) to (3/4,0) to (1,1), and then multiply everything by 1/2 so it gets less weight than the /1 fractions. Do the same thing with the thirds and so forth. Below I’ve drawn the graphs for /1, /2 and /3, though they’re not weighted by 1, 1/2 and 1/3.
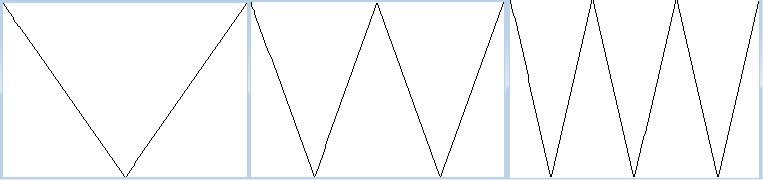
Now repeat for 4, 5, etc. and add all these zigzags together. The resulting graph looks something like this…
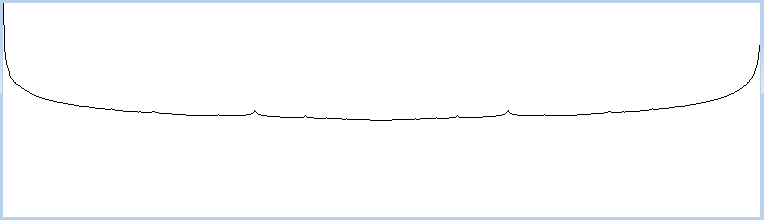
What I was looking for was the minimum value on this graph. Anything with a large value is “close†to a rational number with a small denominator. Anything with a small value is, in some sense, “further†from the obvious rationals that you notice when watching your applet. Well, the min is 0.5, which isn’t really what I was hoping to see.
But I used really simple weighting functions without any obvious justification. So next I tried using x^2 instead of simple lines. The graph is a nice nondifferentiable fractal…
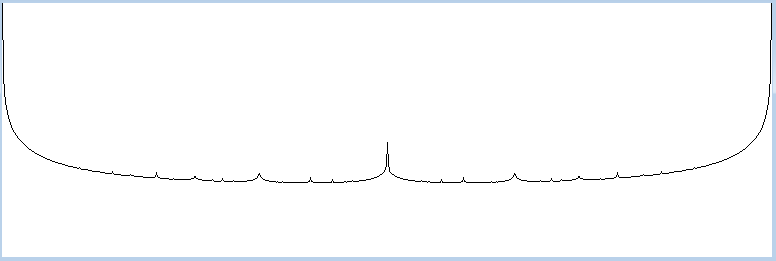
Zoomed in a bit…
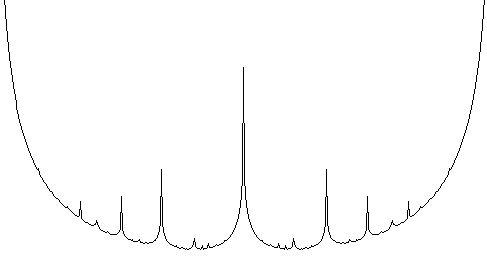
The minimum value on this curve? 0.387. The golden angle is 0.381966 of 2pi, so this is intriguingly close. Switching to using x^3 for the weighting function, you get a min of 0.382.
This is strictly empirical of course, but it feels pretty suggestive. Perhaps the limiting function as the weighting approaches the Dirac delta function (or x^infinity) is exactly the golden angle’s ratio of 0.381966…
August 2nd, 2007 at 12:19 am. Permalink.
- mrs. nerd replied:
guess who’s gonna help the kids with math!
August 2nd, 2007 at 11:26 am. Permalink.
