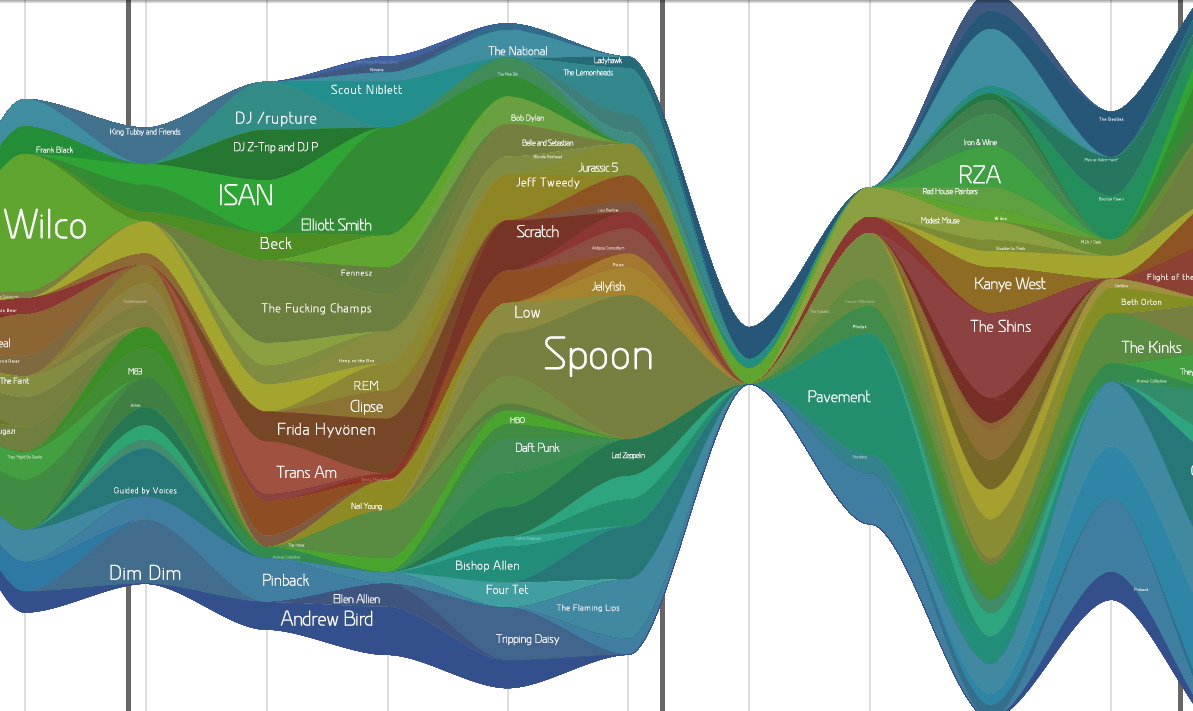
LastGraph
Make graphs of your last.fm listening history at LastGraph.
Get the detailed PDF from which the above was captured (it’s so pretty).
The Mathematics in Music
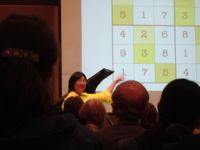
I went to a very interesting performance today: “The Mathematics in Music: a concert-conversation with Elaine Chew”, in Killian Hall at MIT. Elaine is visiting Harvard for the year from USC, where she is a professor. She has an amazingly broad background that is super-pleasing… having studied math, computer science, music performance, and operations research.
Elaine performed four piano pieces, three of which were composed just for her, that use playful tricks in math as compositional inspiration. Some of these tricks included:
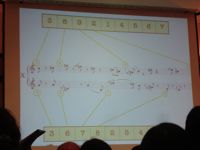
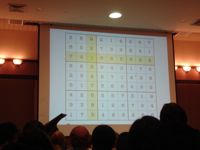
- Composing with a meter determined by the numbers in a row (or column) of a completed Sudoku puzzle. This piece had a different time signature for every measure… 3/8, 1/8, 7/8, 9/8, and so on, accompanied by an entirely different sequence for the other hand. I was very impressed that anyone could play a piece like that. Listening in the audience, you want desperately to tap your foot to ground yourself in some kind of beat, but it’s impossible.
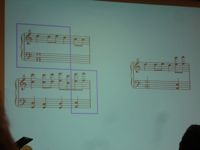
- A bi-tonal piece: right hand and left play in different keys. Chew likened this to patting your head and rubbing your belly at the same time.
- Genetic programming: The composer applies the idea of genetic mutations and substitutions on a familiar theme at the note and phrase level, which results in some jarring effects.
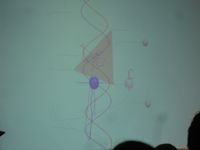
Elaine and her colleague, Alexandre Francois, developed a way of visualizing tonality called MuSA.RT, which accompanied her during two of the pieces. MuSA.RT shows (as a real-time accompaniment to MIDI-enabled piano) the changing notes and key of the piece along a spiral that is kind of like a 3-D version of the Tonnetz. More on the model in Elaine’s paper (PDF).
Martian colors
 I went to see Oliver Sacks talk about his new book Musicophilia at the Cambridge Forum on Monday night, in Harvard Square. He described one very interesting phenomenon that I’ve never heard of before… that colorblind people with synesthesia can sometimes have associations that result in the perception of colors they have never seen in the real world. These colors are called “martian colors”.
(Much more info in this great blog post.)
“Helvetica rejected Sonic Youth.”
I just had the pleasure of watching Helvetica, a film about the font, typography, and the wide range of deep responses we can have to the way we write our letters in space. It is a great movie; go see it if you can.
Director Gary Hustwit was there with us, answering questions after the show. The funniest part was him describing how he got the music for the film (“What does Helvetica sound like??”), most of which was straight from the iTunes playlist he was listening to at the time he conjured up the idea for the film. (Think Four Tet, Caribou, Sam Prekop.) He’s got a background producing music documentaries, so has plenty of connections.
Hustwit says he even got five unreleased, instrumental tracks from Sonic Youth, for him to use in the film. But the tracks just wouldn’t fit, no matter how hard he tried. “Helvetica rejected Sonic Youth.”
The way that this statement makes so much sense is… indescribable to me, and utterly satisfying.
“Visual Music” lecture
I gave my first lecture today. It was a 2.5-hour class on visualizing music, part of the Musical Aesthetics & Media Technology class I am TA-ing.
I spent much of the last few days preparing for this, and I found some impressive examples of visualizing music from the past few hundred years. In fact, there were so many examples that one of the hardest parts of preparing for the talk was defining its scope. I chose the examples I thought were most relevant to telling my version of the story, including Klee, Kandinsky, Oskar Fischinger, the Whitney brothers, Fantasia, all the way up to Ratatouille, the Music Animation Machine, and Martin Wattenberg’s The Shape of Sound. You can see all of these here, in my presentation:
Click image above to download interactive QuickTime slideshow (4.2 MB)
Underlined texts are link-outs, and you can use arrows to navigate through the show.
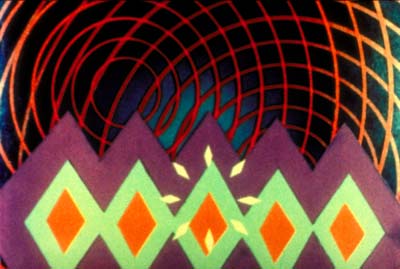
My favorite example of all is Oskar Fischinger’s Allegretto, which blew me away. Unfortunately I can’t find this online, but there is a fantastic DVD with that video available here.
(Tomorrow or Friday I will follow up with a set of links that cover the best examples of visual music that I found, including a couple of killer blog finds. That set will be much larger than what I was able to cover in class today.)
MP3 player software.
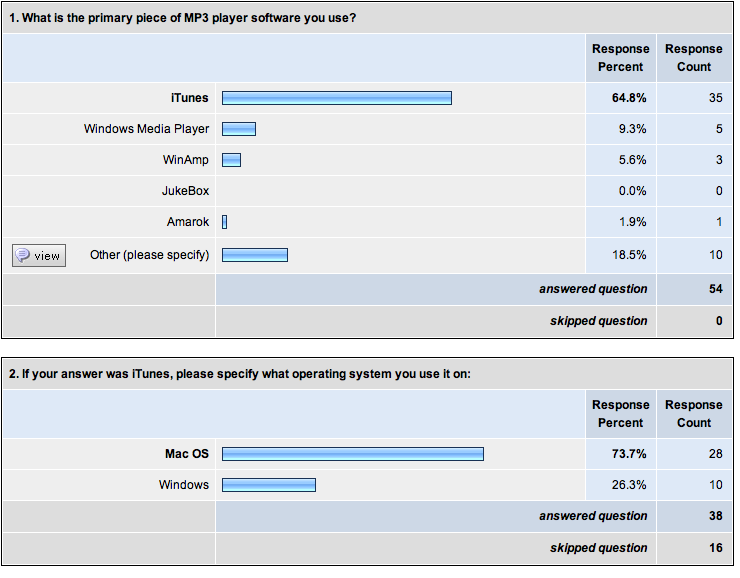
Here are the current results of the survey I posted last night:
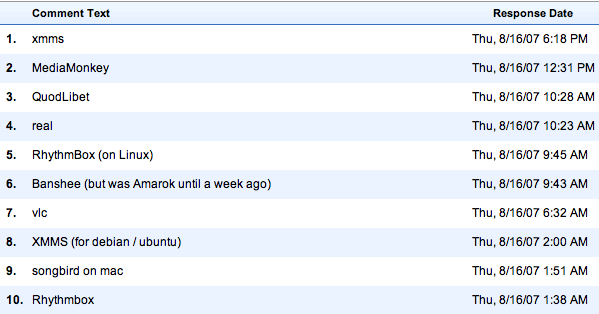
Here’s what the ten people in the “Other” category are using:
Thanks for all of your responses! Even though this is certainly not an unbiased sample set, it looks like building something for iTunes is a pretty safe way to go. Hooray for quantitative decision-making!
MP3 player software?
Maybe you guys can help me learn something… I’m wondering what MP3 player software my friends use.
I set up a very short (2-question) survey at SurveyMonkey:
What MP3 player software do you use?
It should only take 6-10 seconds. And the benefit will last a lifetime. Maybe.
Thanks so much to all who help by answering! Your input will help me decide what my next project — a visualization of your own music listening patterns — will focus on.
Addendum: One day later, I posted the survey results in this blog post.
T.T. the Bear’s Place
Finally went to local music club T.T. the Bear’s last night, to see my friend Nick play with his band, On Fire.
Nick is a guy who was playing at places like this almost before he set foot in them as an audience member. He plays electric viola, along with five other band members who play all manner of things (including, from their myspace page, trumpet and “thundertube wizardry”). To give you an idea of what they sound like… from their homepage: “On Fire has been listening to: Starflyer 59, Arcade Fire, Pelican, Low, Unwound, GusGus, Blonde Redhead and more.” They sounded great.
Flickr pictures tagged with “ttthebears”
Same pictures, sorted by “most interesting”
It was good to finally see the inside of T.T. the Bear’s, which I must have walked past 50 times in the last few months. It’s just the perfect size, like a large living room, with pool room and bar attached. Noisy and cozy.
And my big question: Where did the name come from?
On Cantabrigia:
You may have seen a show at T.T. the Bear’s, but do you know the story of Tough Teddy? He was the beloved pet teddy bear hamster of owners Bonney Bouley and Miles Cares, who opened their Cambridge club in 1985 and found themselves needing a name — and fast.
“I hate telling this story,†said longtime booking agent Randi Millman. “I swear I should make up a story about the name, but there’s the truth as I’ve heard it. God help us.â€
Bach: an illusion of two violins
There is a concept in auditory scene analysis (how we separate and group all the sound sources we might hear at once, like the cocktail party effect) called “auditory streaming”. It just means that we will tend to group sounds of similar pitch into the same perceived object. For example, I could play you a trill on a piano (so, two notes not separated much in pitch), and you would hear it all as one stream. If instead I played two notes separated much more in pitch, you would interpret that as two different streams.
Bach uses this idea in his Prelude for Partita Number 3 for solo violin, to create the illusion of multiple violins. Below is a video of Jascha Heifetz playing the Prelude (http://www.youtube.com/watch?v=ruu1JqRPPic). There are many points during the piece when the violinist bounces back and forth between low and high pitches so quickly that it sounds like two violins are playing. Best places in the video to hear this: 2:30-2:43, 2:59-3:03, and 2:08-2:13.
soundsieve [v1.0]
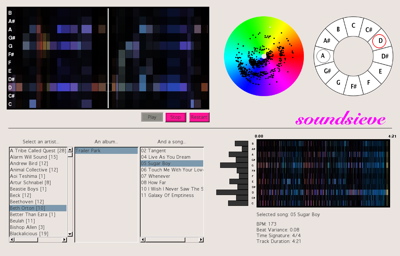
Here’s a screenshot from the thing I’ve been working on for most of the past week:
I was getting it ready to show sponsors this week at the Media Lab. People responded really well, and it was lots of fun talking to people and hearing what they had to say. I already have a long list of things I want to do with it over the summer (starting with making it an iTunes plugin).
Here’s some text from the handout:
soundsieve is a music visualizer that takes the intrinsic qualities of a musical piece – pitch, time, and timbre – and makes their patterns readily apparent in a visual manner. For example, you can quickly pick out repeating themes, chords, and complexity from the pictures and video.
It’s a new, informative way to look at your music. It allows you to explore the audio structure of any song, and will be a new way to interact with your whole music library, enabling you to navigate the entire space of musical sound.
The current form of soundsieve is a music browser (like iTunes), that lets you see visual representations of any MP3 you own. You select a song, and see a set of pictures of the piece’s audio structure. Then you can choose to play the song, and see real-time visualizations accompanying the piece.
I posted some early documentation on the project, but I’ll have to go through and update it soon.
