The Mathematics in Music
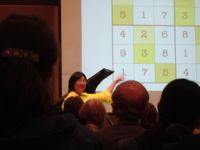
I went to a very interesting performance today: “The Mathematics in Music: a concert-conversation with Elaine Chew”, in Killian Hall at MIT. Elaine is visiting Harvard for the year from USC, where she is a professor. She has an amazingly broad background that is super-pleasing… having studied math, computer science, music performance, and operations research.
Elaine performed four piano pieces, three of which were composed just for her, that use playful tricks in math as compositional inspiration. Some of these tricks included:
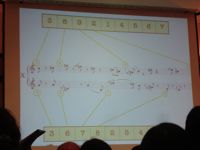
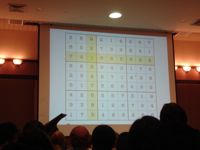
- Composing with a meter determined by the numbers in a row (or column) of a completed Sudoku puzzle. This piece had a different time signature for every measure… 3/8, 1/8, 7/8, 9/8, and so on, accompanied by an entirely different sequence for the other hand. I was very impressed that anyone could play a piece like that. Listening in the audience, you want desperately to tap your foot to ground yourself in some kind of beat, but it’s impossible.
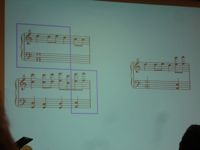
- A bi-tonal piece: right hand and left play in different keys. Chew likened this to patting your head and rubbing your belly at the same time.
- Genetic programming: The composer applies the idea of genetic mutations and substitutions on a familiar theme at the note and phrase level, which results in some jarring effects.
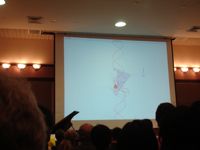
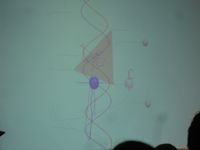
Elaine and her colleague, Alexandre Francois, developed a way of visualizing tonality called MuSA.RT, which accompanied her during two of the pieces. MuSA.RT shows (as a real-time accompaniment to MIDI-enabled piano) the changing notes and key of the piece along a spiral that is kind of like a 3-D version of the Tonnetz. More on the model in Elaine’s paper (PDF).
Whistled language
Some cultures use a whistled language to communicate. This means that speech is emulated in whistling, which can cover much larger distances.
From Wikipedia:
Whistled languages are normally found in locations with difficult mountainous terrain, slow or difficult communication, low population density and/or scattered settlements, and other isolating features such as shepherding and cultivation of hillsides (Busnel and Classe 1976: 27 – 28). The main advantage of whistling speech is that it allows the speaker to cover much larger distances (typically 1 – 2 km but up to 5 km) than ordinary speech, without the strain (and lesser range) of shouting.
…
As two people approach each other, one may even switch from whistled to spoken speech in mid-sentence.
This page has a nice example of a whistled conversation in Sochiapam Chinantec, a tonal language spoken in part of southern Mexico. The whistled version of the language is only spoken by men. (The conversation is interrupted by a modern telephone ring, which amused me greatly.)
Another example of whistled language, ‘Silbo Gomero’: CNN.com — “Nearly extinct whistling language revived”
Thanks to Chris for sharing such excitement about the Pirahã people and their language.
The chirping of bats
Neuroscientist and bat researcher Cynthia Moss came to talk at MIT this afternoon about how bats use direction, timing, and frequency in their sonar vocalizations to locate insect prey. Her presentation was (wonderfully) full of video, in which the picture and audio had been slowed down by about 16 times, so that we could better see and hear the bat activity.
I was astounded at how interesting these bat vocalizations are. Here I thought bats were like little submarines, just going, “beep… beep… beep…”, but they vary the frequency and pitch range of their chirps dramatically while tracking a target. I found links to some similar videos (short, longer) on Dr. Moss’s group website.
Strangely, this reminds me very much of Ed Boyden‘s “logarithmic time planning” on his Tech Review blog. Makes me think we are all little bats, chirping in our own way when the right bug comes along.
More info on this work can be found here:
Auditory Scene Analysis by Echolocation in Bats: Insect capture Studies & Aim of the Bat’s Sonar Beam
Bach: an illusion of two violins
There is a concept in auditory scene analysis (how we separate and group all the sound sources we might hear at once, like the cocktail party effect) called “auditory streaming”. It just means that we will tend to group sounds of similar pitch into the same perceived object. For example, I could play you a trill on a piano (so, two notes not separated much in pitch), and you would hear it all as one stream. If instead I played two notes separated much more in pitch, you would interpret that as two different streams.
Bach uses this idea in his Prelude for Partita Number 3 for solo violin, to create the illusion of multiple violins. Below is a video of Jascha Heifetz playing the Prelude (http://www.youtube.com/watch?v=ruu1JqRPPic). There are many points during the piece when the violinist bounces back and forth between low and high pitches so quickly that it sounds like two violins are playing. Best places in the video to hear this: 2:30-2:43, 2:59-3:03, and 2:08-2:13.
Spirals, scoops, sailing
Today was awesome.
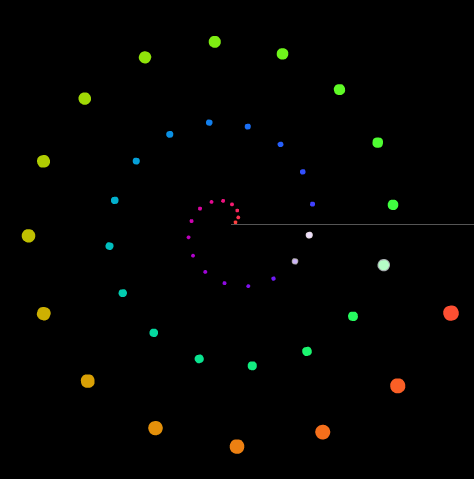 I met a fun guy named Ned Gulley, who works at Mathworks. He showed me this great thing: Fermat’s spiral. He introduced me to the spiral by pointing out that KrazyDad did some amazing musical visualizations using this pattern. You definitely should look at these two in particular, to see the pattern at work:
- Whitney Music Box
(This reminds me of the Electroplankton Nintendo DS game.) - Fibonacci Logos screensaver from this post: “The motion in this screensaver is actually quite simple — if you look at each disc, you’ll see that it is just sitting in place, rotating at a constant rate. However, each disc spins slightly faster than the next largest one, which produces a series of very interesting patterns over about a 10 minute cycle.”
Very cool. Thank you, Ned!
- Whitney Music Box
- After dinner with my group, we went to one of the most comfy places in Cambridge, Toscanini’s ice cream, and I got the best flavor: ginger snap molasses. I asked my favorite ice cream guy how many scoops of ice cream is in each one of those big tubs. He said, “Well, I’m not totally sure… but… there are usually about three gallons of ice cream in each one… and each scoop is 6 ounces. ‘2 scoops’ is 8-10 ounces.”
First off, “2 scoops” ain’t 2 scoops! Who knew. (…although “2 scoops” doesn’t cost twice as much either, so I’m not complaining.)
I told him I would figure out how many scoops were in a tub and let him know. After some argument at the table over how many cups/ounces/monkeys are in how many gallons, we decided that the answer is about 75 scoops. (128 oz. x 3 gallons / 5 oz. = 75. ish.)
- Sailing and learning to sail at MIT are FREE! I hope to try it out this summer.
soundsieve [v1.0]
Here’s a screenshot from the thing I’ve been working on for most of the past week:
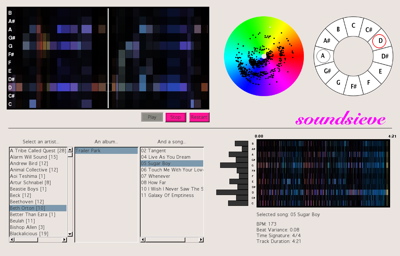
I was getting it ready to show sponsors this week at the Media Lab. People responded really well, and it was lots of fun talking to people and hearing what they had to say. I already have a long list of things I want to do with it over the summer (starting with making it an iTunes plugin).
Here’s some text from the handout:
soundsieve is a music visualizer that takes the intrinsic qualities of a musical piece – pitch, time, and timbre – and makes their patterns readily apparent in a visual manner. For example, you can quickly pick out repeating themes, chords, and complexity from the pictures and video.
It’s a new, informative way to look at your music. It allows you to explore the audio structure of any song, and will be a new way to interact with your whole music library, enabling you to navigate the entire space of musical sound.
The current form of soundsieve is a music browser (like iTunes), that lets you see visual representations of any MP3 you own. You select a song, and see a set of pictures of the piece’s audio structure. Then you can choose to play the song, and see real-time visualizations accompanying the piece.
I posted some early documentation on the project, but I’ll have to go through and update it soon.
Hedy Lamarr and frequency hopping
 We’ve been learning about radio frequency transmission in sensors class, and today Ari told us about how actress Hedy Lamarr and composer George Antheil came up with the idea of frequency hopping to avoid jamming of radio-controlled torpedoes during WWII. The best part was their idea to use a roll from a player piano, on both the torpedo and transmitter, to change the transmission frequencies. I had fun looking at their patent here.
From http://hypatiamaze.org/h_lamarr/scigrrl.html:
Hedy knew that “guided” torpedos were much more effective hitting a target, a ship at sea for example. The problem was that radio-controlled torpedos could easily be jammed by the enemy. Neither she nor Antheil were scientists, but one afternoon she realized “we’re talking and changing frequencies” all the time. At that moment, the concept of frequency-hopping was born.
Antheil gave Lamarr most of the credit, but he supplied the player piano technique. Using a modified piano roll in both the torpedo and the transmitter, the changing frequencies would always be in synch. A constantly changing frequency cannot be jammed.
They offered their patented device to the U.S. military then at war with Germany and Japan. Their only goal was to stop the Nazis. Unfortunately or predictably, the military establishment did not take them or their novel invention seriously. Their device was never put to use during World War II.
From http://en.wikipedia.org/wiki/Hedy_Lamarr#Frequency-hopped_spread_spectrum_invention:
Lamarr’s frequency-hopping idea served as the basis for modern spread-spectrum communication technology used in devices ranging from cordless telephones to WiFi Internet connections.
Lamarr was awarded by the EFF in 1997 for her contributions to this invention.
Spectrograms to hide images in music
Spectrograms are pictures of sound over time. People use them to visualize waveforms, often to try to highlight musical relationships or sounds in speech.
Here’s what someone saying “She sells sea shells” looks like (spectrogram on bottom):

You can go the other way, too, by drawing a picture in a spectrogram and playing the sound it represents. Several musicians have used this to hide pictures in their albums. In many cases, you’ll hear some weird noise at the end of a track… and when the waveform is put through a spectrum analyzer, you get the picture back.
There are some fairly ridiculous examples of this…
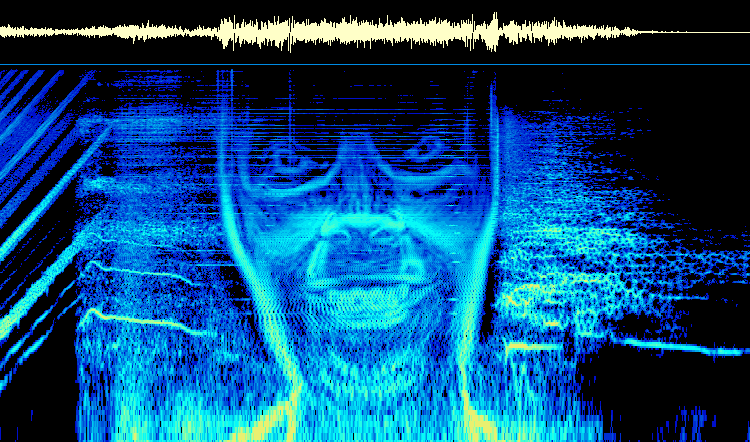 Aphex Twin: Windowlicker |
 NIN: viral marketing |
 NIN: My Violent Heart |
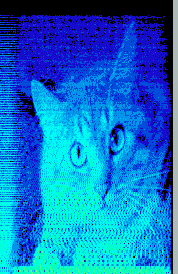 Venetian Snares: Songs About My Cats |
A good description of finding these hidden pictures can be found here: http://www.bastwood.com/aphex.php
…and, of course, there is a Wikipedia section devoted to it.
Lightning and thunder (and tweeks, sferics, and whistlers)
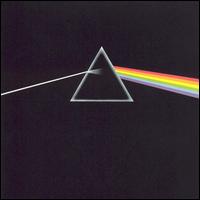 The sound that comes from lightning sounds the way it does – a crack followed by a rumble – because the high frequency sounds from the explosion travel more quickly through the atmosphere than the lower frequency sounds. This is called “dispersion” ((http://www.physics.uoguelph.ca/summer/scor/articles/scor163.htm — best link if you’re just going to read one of these)). It’s the same phenomenon that you see in optics when light gets split through a prism.
The farther you are from the lightning, the more low frequency sound you will hear in the thunder ((http://www.madsci.org/posts/archives/nov99/943317470.Ph.r.html)). This is due to both dispersion, which attenuates the high frequencies more ((http://www.physics.uoguelph.ca/summer/scor/articles/scor163.htm)), and diffraction, which helps low frequency sounds “bend around” obstacles better than high frequency sounds ((http://hyperphysics.phy-astr.gsu.edu/hbase/sound/diffrac.html)), so they can travel farther.
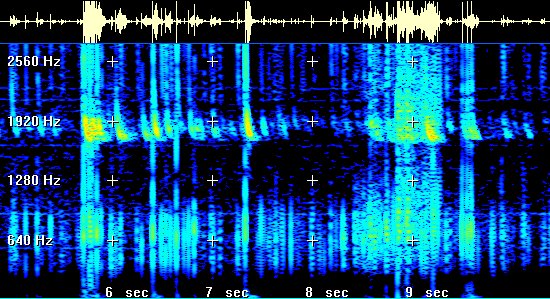
Radio waves are affected by dispersion as well. While reading about lightning and thunder, I stumbled across this amazing thing: very low frequency (VLF) radio receivers for the Earth’s natural radio emissions. The sound samples on this page are really cool.
This is crazy stuff. You can listen to a live VLF audio stream through the NASA online VLF receiver.
Hearing the Escher staircase
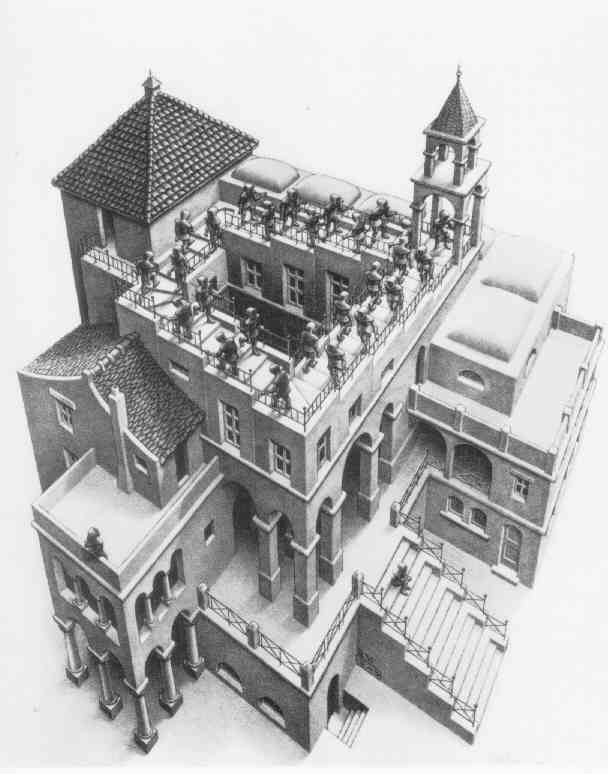 You know this staircase, right?
In class, we heard the auditory analog of this visual illusion: the “Shepard-Risset glissando”, named after the two guys who worked on it. [sound sample]
The trick here is that the sound contains four notes all an octave apart, with the loudness of each note sneakily adjusted as the pitch of the notes climbs.
To understand this trick better, here’s a good visualization and demo of the discrete Shepard scale:
Visualization of the Shepard Effect
Much more discussion of how it all works on the Shepard tone Wikipedia page, which includes another sound sample of the glissando…
An independently discovered version of the Shepard tone appears at the beginning and end of the 1976 album A Day At The Races by the band Queen. The piece consists of a number of electric-guitar parts following each other up a scale in harmony, with the notes at the top of the scale fading out as new ones fade in at the bottom. Lose Control by Missy Elliott also seems to feature an ascending Shepard tone as a recurring theme (via the sampled synthesizers from Cybotron’s song “Clear”.) “Echoes”, a 23-minute song by Pink Floyd, concludes with a rising Shepard tone.
